Flame Synthesis of Inorganic Nanostructures
This area of research focuses on a technique to convert inexpensive commercial high purity bulk metals into novel 1-D and 3-D TMO nanostructures through the application of a flame medium. The combustion of Transition Metal Oxide (TMO) nanostructures, mixed (MTMOs), hybrid nanomaterials (Carbon/TMOs) the nano- and micro-scale are being developed in our lab. The formed TMO structures with modified chemical compositions and morphologies possess unique electronic and mechanical properties and have generated great interest for industrial and medical applications.
Flame Formed Mo/W Oxide Nanostructures
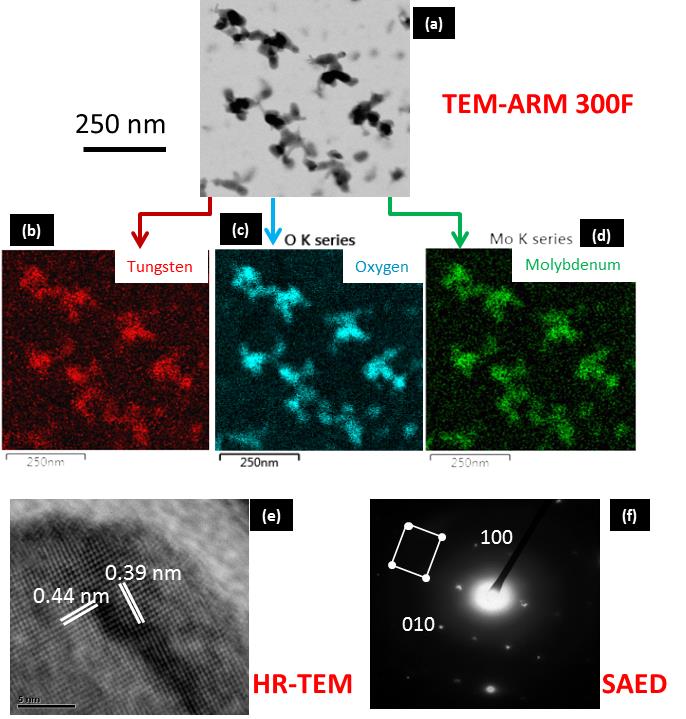
Electron microscopy of the tungsten-doped MoO3 nanostructures: (a) TEM image of the nanostructures; EDS mapping of (b) tungsten, (c) oxygen, and (d) molybdenum in W-doped MoO3; (e) HR-TEM image of a nanostructure; (f) SAED pattern of grown W-doped MoO3.
Solid Support Synthesis 1D C/W Nanorods
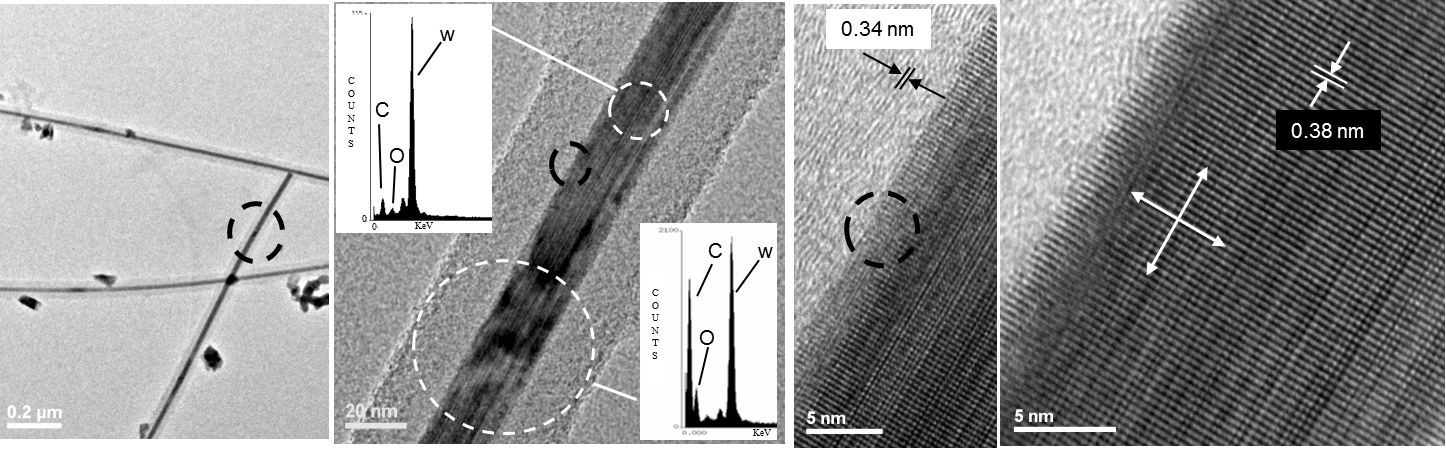
TEM, atomic-resolution-TEM, and EDX analysis on a selected hybrid nanowire formed in a counter-flow flame. Deposition time of 2 minutes.
Gas-phase Synthesis of W-Oxide Nanoplatelets
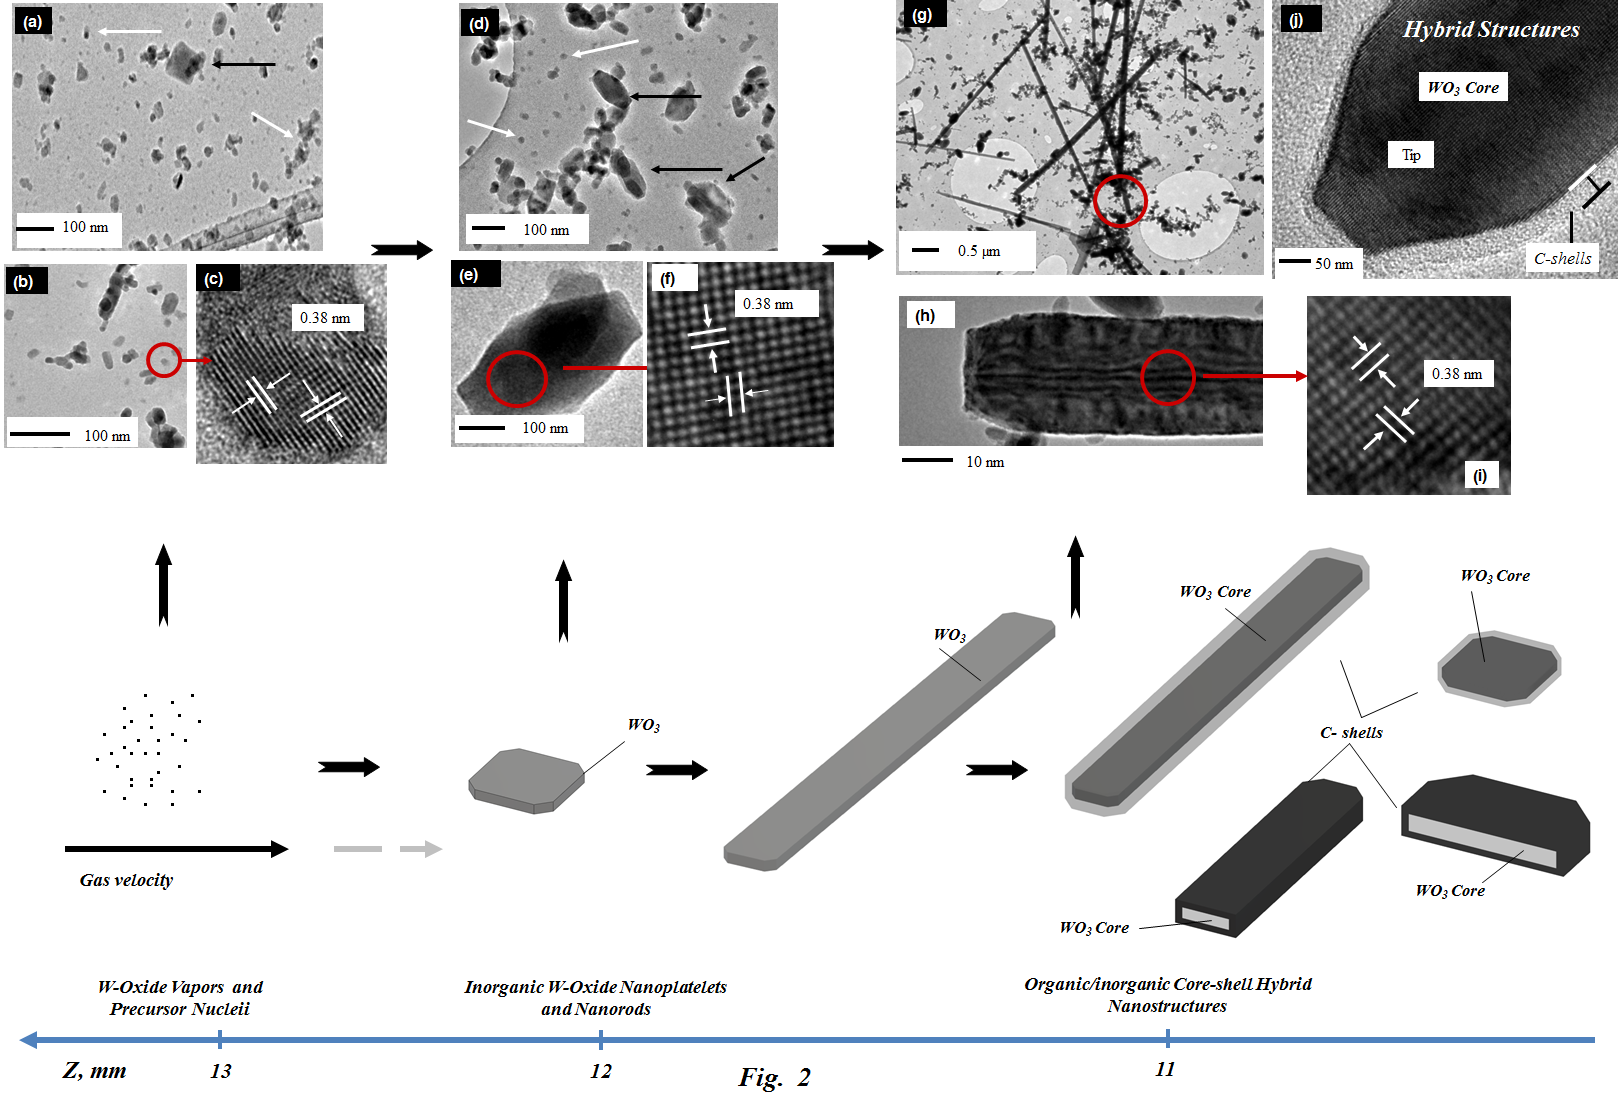
W-oxide TEM images and computer generated graphics showing a representative progression of nanoplatelets and rod-like structures in the reacting flame environment. A W probe is fixed in the lower part of the oxygen-rich zone at the flame position of Z = 13 mm while samples are thermophoretically captured at various flame heights. The computer generated graphics resemble the true morphology of formed structures. Note that in a, the wire-like structure at the lower right corner is a part of the holey carbon film used in this study
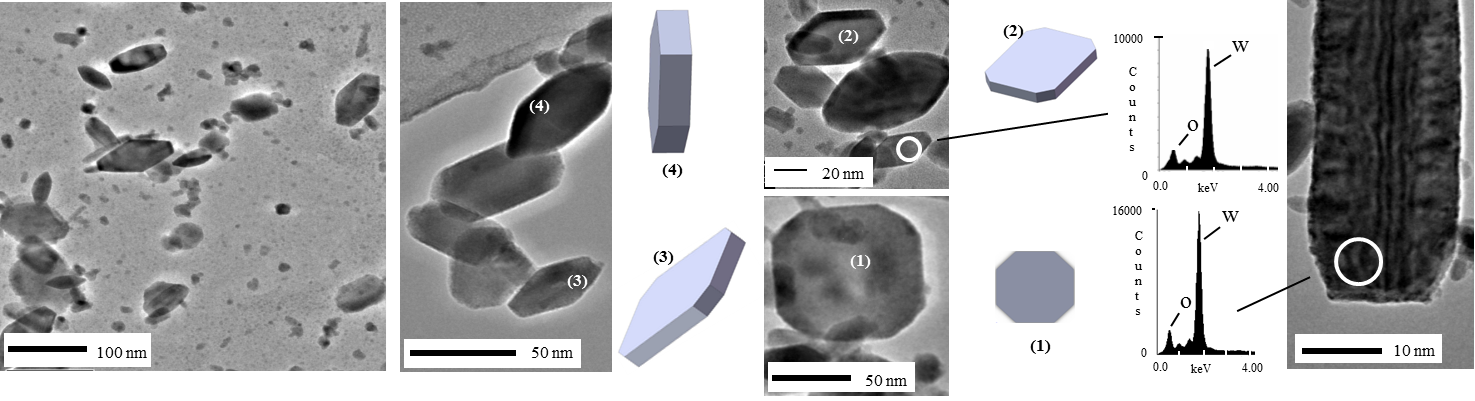
TEM, HR-TEM, EDX, and SAED analysis on a selected hybrid nanowire formed at the flame height of Z = 12mm for a deposition time of 2 minutes: (a) low and high resolution TEM images of the nanowire, (b) upper and lower insets showing EDX spectra obtained on the nanowire using various diameter electron beam spots, (c) and (d) HR-TEM showing the morphology of the core and shells. SAED collected from the surface of the structure is shown in the inset of (d).